Changing the display options
for a layer can be done from the layer Properties window (right click on the
Layer in the TOC and select "Properties" from the context menu. Click
"Apply" to apply the changed settings. Clicking "Close" only closes
the Properties window.
Depending on the type of layer, different Properties window will be displayed.
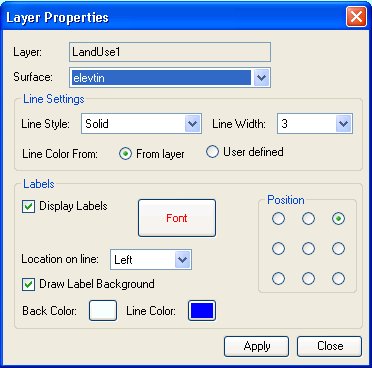
Polygon layer - displayed when the
selected layer is of Polygon type and so the representation in the
Profile Window is lines draped on the Profile line. The user
can adjust the following:
The related surface on which
the layer will be draped.
The display of the derived
lines by changing their line style and width
Line Color From
option. When "From layer" is specified, the line color of
the draped polygons is taken from the Layer polygon symbols on
the Map (polygon fill color). This honours Category (only by
single field) or Quantity classification that has been applied.
When "User defined" is selected, only one color is applied to
all lines and is selected by the user in the Properties form.
Labels - the user
can specify whether labels are displayed, their location along
the line (left, centre or right), their font, color, style,
background and position.
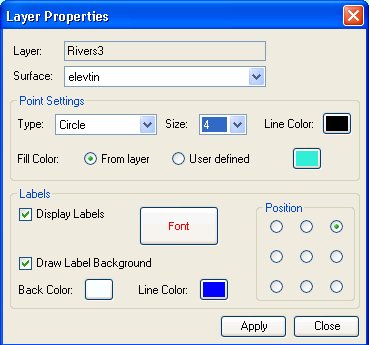
Polyline layer -
displayed when the selected layer is of
Polyline type and so the representation in the Profile Window is
points draped on the Profile line. The use can adjust:
The related surface on which the layer will be
draped.
Point Settings - the user can
change the type, size and line color of the draped point. The
"Fill Color" has two options. When "From layer" is specified,
the fill color of the symbols is taken from the Layer line symbols
on the Map (line color). This honours Category (only by single
field) or Quantity classification that has been applied. When
"User defined" is selected, only one color is applied to all symbols
and is selected by the user in the Properties form.
Labels - the user can specify
whether labels are displayed, their location along the line (left,
centre or right), their font, color, style and position.
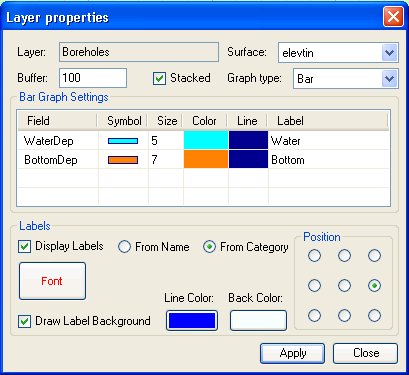
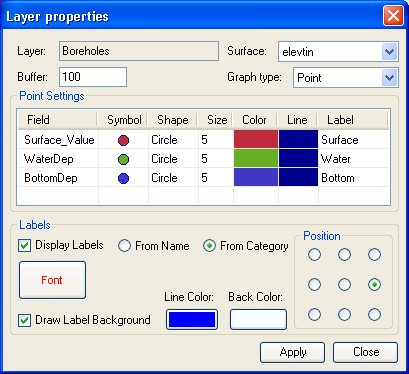
Point layer -
displayed when the selected layer is of
Point type and so the representation in the Profile Window can be
Points, Line graph or Bar graph. The use can adjust:
The related
surface on which the layer will be draped. Please note
that for Line and Bar graphs, the Surface Value at the point is
always taken into account. Non stacked graphs are
displayed from the surface elevation to the calculated field
elevation and stacked graphs include the surface elevation in
the sorted elevation list. For Point graphs the surface
elevation can be included or excluded by the user.
The buffer distance for
selection of points
The Stacked option for the
Line or Bar chart. The Stacked option has no meaning when
the graph is based on Thickness values.
The graph type - Point, Line
or Bar. Please note that when the Surface Value is
included in the list for Point graph, it will not exist in the
list when the type is changed to Line or Bar graph. Still
the Surface Value is included in the graph display as described
above.
The size, color, symbol and
label for each graph category. Graph categories can be moved up
and down in the table by drag and drop - the topmost category is
displayed on top of the lower categories.
Graph categories can be moved up and down in
the table by drag and drop - the topmost category is displayed
on top of the lower categories. By specifying a size of 0, the
category will not be displayed.
The display of labels with adjustment of
their font, color, background and location.
The label for each graph can be taken from
the Name field or from the Category Label