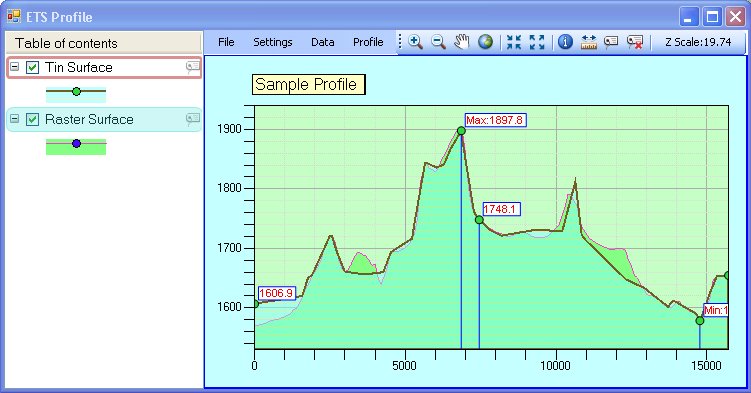
The Profile Window is the dialog where the profiles are displayed. The user can adjust various settings and once happy with the results, export the data or image of the profile, draw the profile in the Data Frame or the Layout.
Functionality in the Profile window is available through the Main Menu displayed on top of the dialog, the Main Toolbar (next to the Main Menu) and the Context Menu for the Table of Contents (right click on a layer name in the TOC).
Over the chart area the user can use the mouse wheel to zoom in by turning it forward or zoom out by turning it backward. Pressing the mouse wheel (or middle button) and moving the mouse will pan the profile accordingly. Pressing the right mouse button will create a tooltip displaying the Station and Height at the mouse location. To remove the tooltip, press the right button again.
- Table of contents (TOC) - located on the left side shows the
names of layers displayed in the Profile Window. The layer at the
top of the table is displayed on top in the Profile Window. From
the TOC the user can control the following:
- The order in which the layers are displayed by dragging and dropping the TOC items up and down the list
- The visibility of each layer by clicking on the check box
- Expand the layer by clicking on the plus/minus sign to show the layer symbol(s)
- The style for drawing the layer by opening the Properties Window - either double click on a Layer name of right lick and select Properties from the context menu
- Show Data Points for a profile by right clicking on the Layer name and checking the "Show Data Points" status
- Set the Identity layer by selecting the "Set Identify" from the context menu. There can be only one Identity layer in the Profile Window. It is displayed with a brown outline in the Table of contents.
- Include or exclude the Profile in the list of layers for which labels will be created when using the Label tool (by checking the value in the context menu). The layers enabled for labels have a label icon on the right hand side in the Table of contents.
- Remove the Layer from the Profile Window by right click and select "Remove layer" from the context menu
- Main menu
- File Menu - include the following items
- Hide/Show Table of contents - hides or shows the Table of contents
- Save Project - allows the user to save the current settings in a project file. The drawing styles for all layers are saved as well as the general profile settings. If a project file is used its name is displayed in the title of the window.
- Save Project As - saves the current settings in a new project file which becomes the current project file
- Open Project - opens a project file (.etprj). When the user selects the project file, its contents are checked against the current Map to determine the existence of layers. A status window is displayed showing the required layers and their availability in the Map. If all the layers in the project file are found in the Map and comply with the requirements, the file is loaded and applied to the current profile polyline.
- Add Surface - allows the user to add another surface layer to the Profile Window. All surface layers, which are not already present are included in the selection list (including not visible layers) If all surface layers in the Map are already present in the Profile Window, a message is displayed to inform the user.
- Add Layer - see Adding Layer options
- Save profile in currently edited layer - see Export options
- Save profile in a new feature class - see Export options
- Export profile as text file - see Export options
- Save as image - see Export options
- Settings Menu
- Profile Settings - opens the Options window allowing the user to change general settings - Title, colours and fonts for display of the background, grids, axis settings as well as settings for data display
- Line of sight settings - allows the user to change settings for Line of Sight display - only available with Line of Sight display
- Sample Distance - allows the user to change the sample distance for profile generation
- Data Menu
- View Profile Data - displays X, Y and Z for each data point of a profile together with the station (distance from the start of the cross-section polyline, along the polyline). If multiple profiles are drawn in the Profile Window, the data for all profiles can be displayed by selecting the "All" option. Since profiles of different types may have different data points, the data points are merged and sorted, and Z values for each surface calculated for the resultant list of data points.
- View Profile Statistics - displays several important
characteristics of each profile:
- 3D Length
- 2D Length
- Maximum Z value
- Minimum Z value
- Length Uphill
- Length Downhill
- Average Slope Uphill
- Maximum Slope Uphill
- Average Slope Downhill
- Maximum Slope Downhill
- Profile Menu
- Add Label at Station - adds a label on the profiles at user specified station along the cross-section polyline
- Delete All Labels - removes all labels displayed on the Profile Window
- Profile Cross-sections Along Route - see Animate Profile
- Draw Profile on View - see Draw on View
- Draw Profile on Layout - see Draw on Layout
- File Menu - include the following items
- Tool Bar - has several tools, many of which do not need explanations
- Zoom In
- Zoom Out
- Pan
- Zoom Full Extent
- Fixed Zoom In
- Fixed Zoom Out
- Identify - displays for the user clicked location on the profile Z, Station and Slope for the Identity layer. A point is drawn for the same location on the cross-section line in the Data Frame (the View). The Identity layer can be changed by right clicking on the layer name in the table of contents and selecting "Set Identify".
- Measure - allows measurement of horizontal or vertical distances in the Profile Window. With the Measure tool selected press and hold the mouse button and drag the mouse cursor across the window. The measured distance is displayed in the toolbar next to the Measure tool
- Label - Draws a label with Z value for the profiles at user clicked point.
- Delete Label - deletes the clicked label.
- Z scale indicator - displays the current Z scale - the difference of the representation of the distances in length and height. Z Scale = 2 for example will mean that 250 meters height will be equal to 500 meters length on the profile display. Initially the Z Scale is calculated automatically for best fit in the Profile Window. The user can adjust the value of the Z Scale at any time - see Profile Settings