Allocating demands to service points using ET GeoWizards.
A very common GIS task is to analyze the location of service centers (hospitals, stores, cell phone towers etc.) based on the demand (people that are using the service). The purpose of this document is to describe a method for allocation of customers (census polygons) to service centers (points) using the functions available in ET GeoWizards.
The process has three major steps:
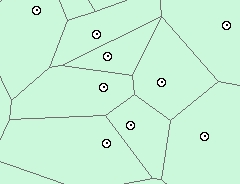
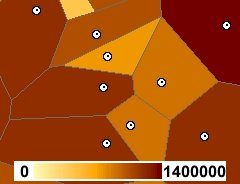
- Delineating the service areas of the existing service centers using Thiessen Polygons:
Thiessen polygons (also referred to as Voronoi Diagram), define the individual regions of influence around each point of a set of points. Thiessen Polygons divide a plane, assigning the area to point in the set such that any location within a particular polygon is nearer to that polygon's point than to any other point. - Assigning the demand from the census polygons to the service areas using the spatial intersection of the two sets of polygons.
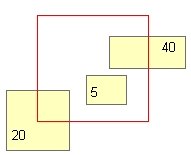
Example: Three source polygons with values 20,5 and 40 in the field to be transferred.
The target polygon overlaps a quarter of the first polygon, the entire second polygon and a half of the third polygon
The value for the target polygon will be calculated using the formula:
1/4*20 + 1*5 + 1/2*40 = 30Note that the assumption is that the value is evenly spread over the area which is not always the case. The more representative the source data is, the better the results will be.
- Assigning the demand calculated for each service polygon back to its service center
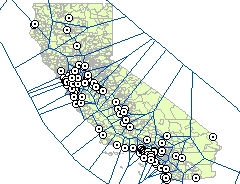
Two input datasets - a polygon dataset with population attribute and point dataset representing the available service centers. We need to assign for each point the population that will be serviced by this point
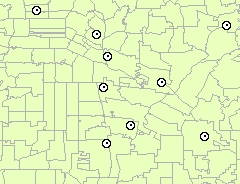
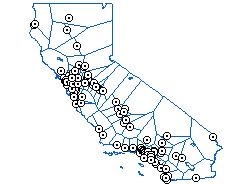
ZIP code dataset for California and some Service points
The ZIP code polygons have a population attribute
The solution
Step1: Build Thiessen polygons. In order the entire area to be covered, the "Use buffered convex hull" option with large enough buffer distance has to be used
Step2: Clip the Thiessen polygons with the ZIP code polygons
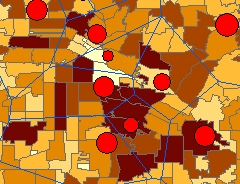
The resulting service area for a smaller area
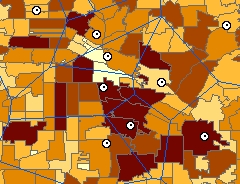
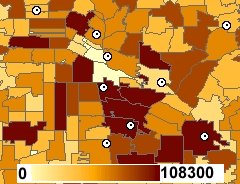
The Service area overlaid with the Demand polygons
Step 3: Transfer the population attributes from the ZIP polygons to the Thiessen polygons. Use the "Count" (sum proportion) option
Step 4: Transfer attributes from the Thiessen polygons to the Service points using Spatial Join.
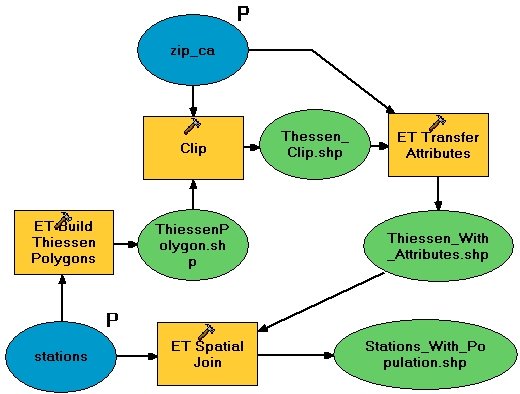
Sample Model of the entire process (ArcGIS Desktop and ArcGIS Pro only)